Output
Molecule Visualisation Dashboard
Once the user clicks on Visualise Results (in Figure 2), the visualisation dashboard (fig 3) is loaded. It supports the following functionalities:
- Columns: User-friendly interface to show/hide selected properties
- Filters: The user can apply column-wise filters to each of the columns
- Density: The user can change the compactness of the table
- Export: to download the output molecules as a .csv file
- Grid View: Comfortable Visualisation of the generated molecule
- “Predictions table” contains the following columns:
- SMILES: The SMILES string of generated molecules
- 2D-Representation: the 2d structure of the molecule as shown below
- Actions: The button(Pen) in each row to load the molecule in MolBench is provided.
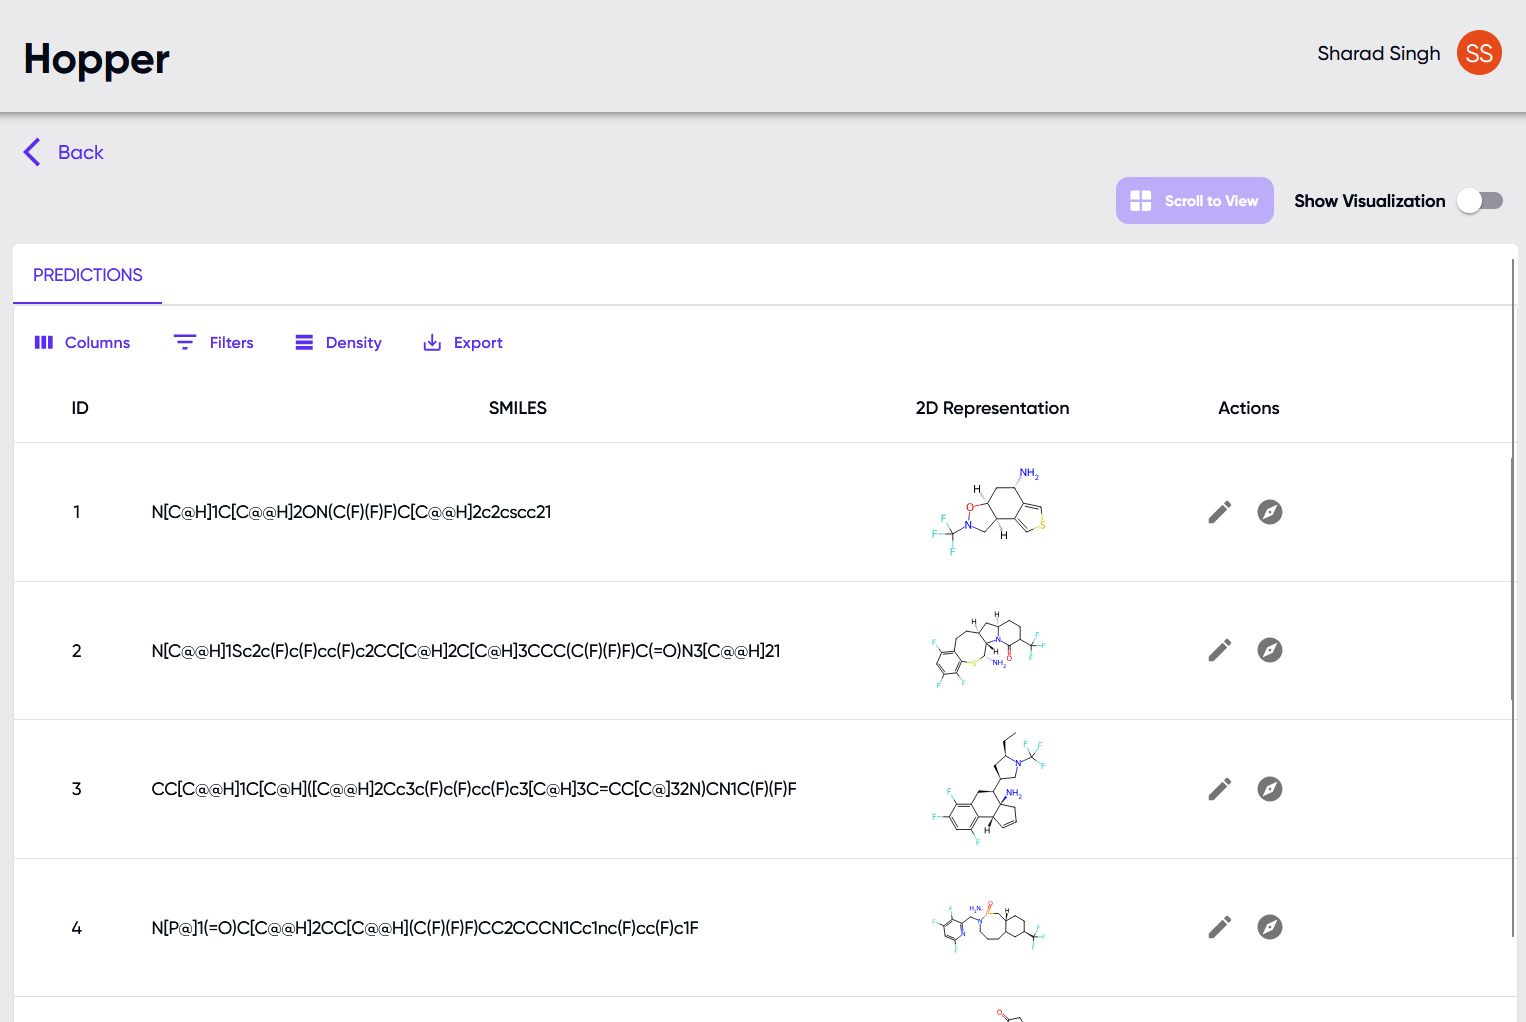
Figure 3: Results table
- Grid View: The grid view shows the molecule structure tiles(Figure 4).
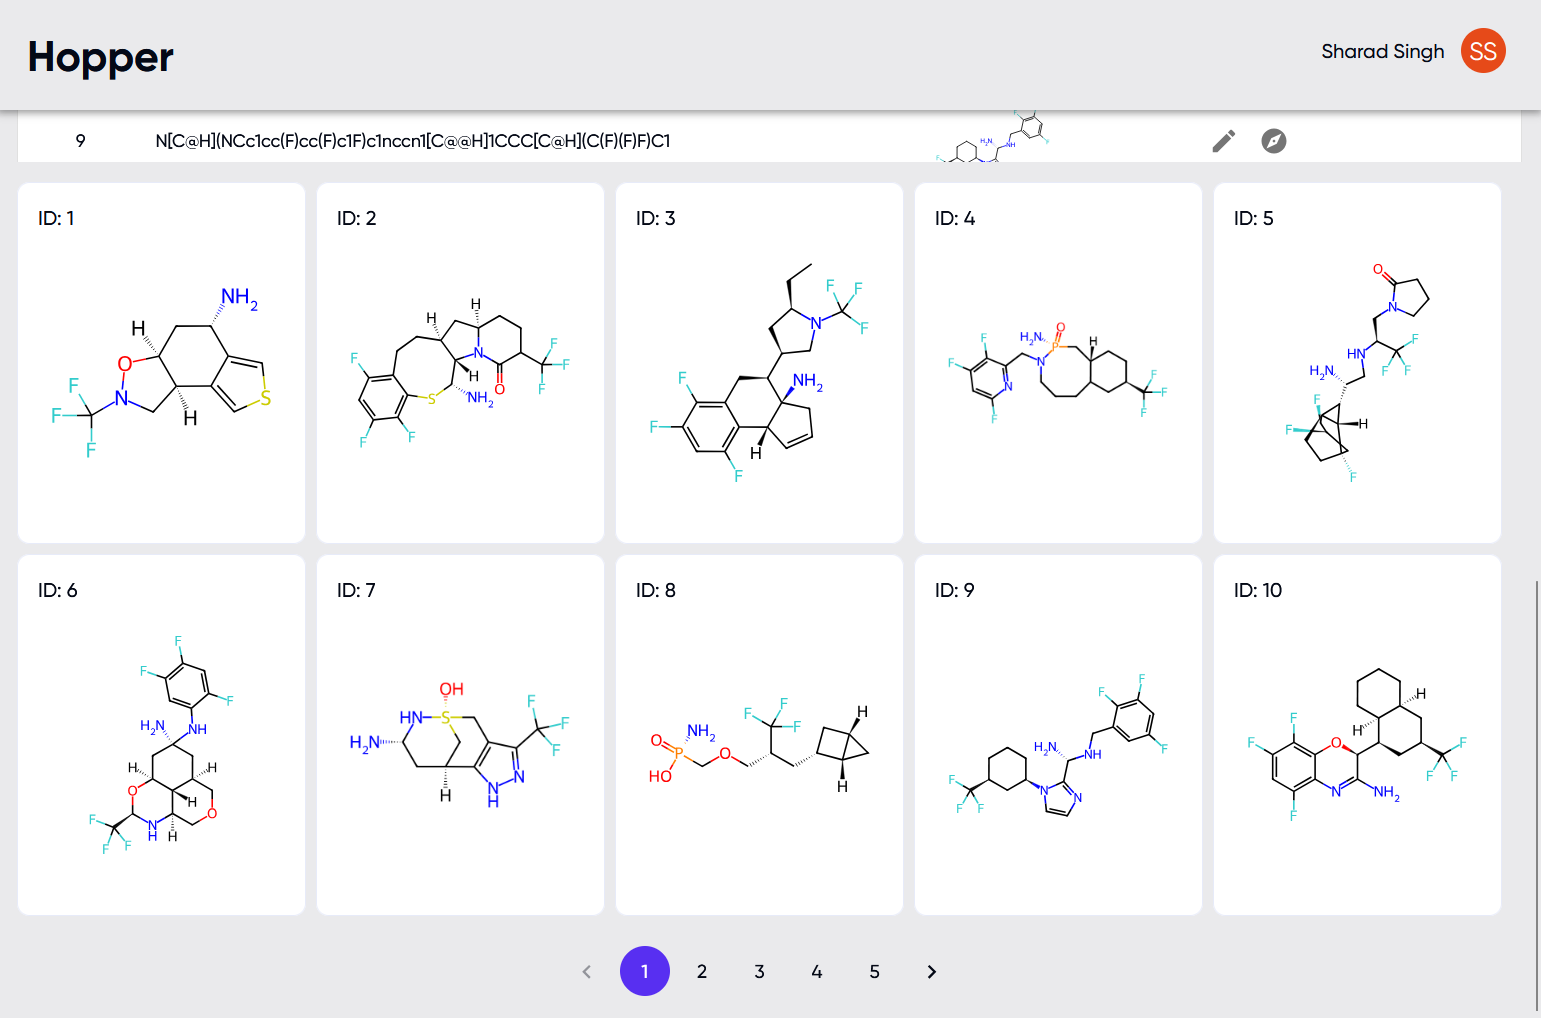
Figure 4: Grid view
- Back: - It takes the user back to the main page of the Hopper